TL;DR: The global video game market generates roughly $188 billion annually across 3.4 billion players, but that money and audience are distributed with extreme asymmetry. Mobile accounts for 49% of all revenue ($92 billion) and over 80% of all game installs, yet only 2% to 4% of mobile players ever spend money. Meanwhile, PC ($40 billion) and Console ($53 billion) command smaller total player counts (roughly 900 million and 650 million respectively), but boast extraordinary monetization depth, high upfront willingness to pay, and multi-hour daily engagement. Choosing where to launch is no longer just a technical question of engine support. It is an economic calculation involving platform fees, discovery algorithms, and user acquisition math.
┌────────────────────────────────────────────────────────────────────────┐
│               GLOBAL VIDEO GAME PLATFORM LANDSCAPE ($188B)             │
├────────────────────────────────────────────────────────────────────────┤
│                                                                        │
│                    Global Gaming Market ($188B / 3.4B Players)         │
│                                       │                                │
│        ┌──────────────────┬───────────┴───────────┬──────────────────┐ │
│        ▼                  ▼                       ▼                  ▼ │
│     MOBILE             CONSOLE                   PC              WEB/UGC
│  ($92B / 49%)       ($53B / 28%)            ($40B / 21%)        ($3B / 2%)
│        │                  │                       │                  │ │
│        ├─ Apple App Store ├─ PlayStation Network  ├─ Steam (Valve)   └─ Poki,  │
│        │  $52B / 650M     │  $27B / 123M MAU      │  $10B / 135M MAU    Crazy, │
│        │                  │                       │                     Roblox │
│        ├─ Google Play     ├─ Nintendo Switch      ├─ Epic Games Store   Web    │
│        │  $31B / 2.1B     │  $13B / 125M Players  │  $1.0B / 75M MAU           │
│        │                  │                       │                            │
│        └─ Third-Party     └─ Xbox / PC Game Pass  └─ Direct PC / MMOs          │
│           Android ($9B)      $13B / 120M MAU         $29B (Riot, BNet)         │
│                                                                        │
└────────────────────────────────────────────────────────────────────────┘
The Great Platform Mirage
When game creators look at industry headlines, it is easy to be seduced by raw audience numbers. Every month brings reports of another mobile title crossing 100 million downloads, or a platform boasting over two billion monthly active devices.
Yet when game developers talk openly about financial survival, a curious inversion appears:
- Studios launching casual mobile games with half a million organic downloads can struggle to cover their cloud server costs.
- A solo developer releasing a niche $20 roguelike on Steam with 40,000 sales can build a profitable, multi-year business.
- A premium console release on PlayStation or Nintendo Switch can sell at a $60 or $70 ticket price with zero recurring ad spend.
The reason is simple: game platforms do not measure success in the same currency.
Mobile is a high-velocity siphon where traffic is abundant, attention is fractured, and survival depends on paid user acquisition math. PC is a merit-based discovery engine driven by community reviews, wishlists, and deep simulation habits. Console is a curated digital living room where dedicated enthusiasts expect polish, prestige, and cinematic production values.
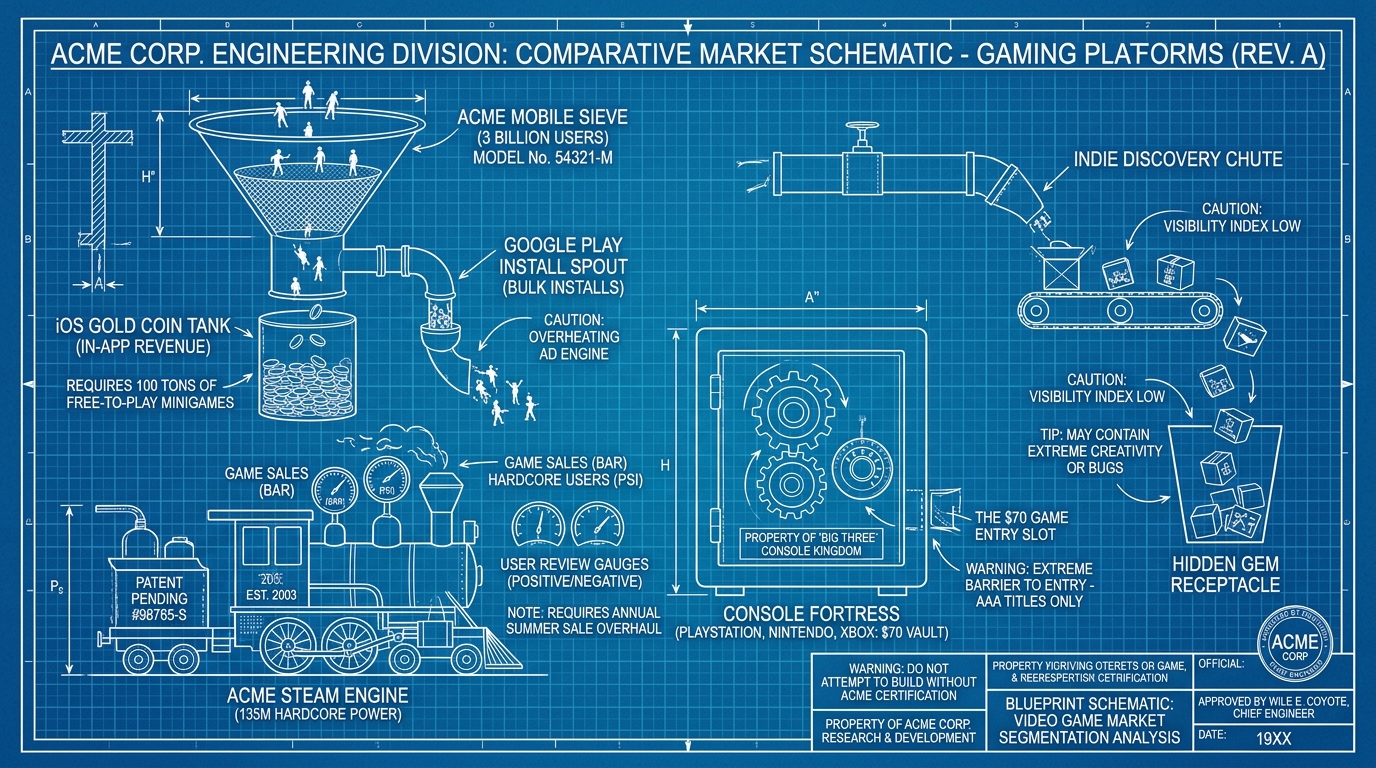
Market Size Master Matrix
To understand where player time and developer revenue actually flow, let us examine the numbers across the entire gaming landscape. The data below synthesizes industry metrics from Newzoo, Sensor Tower, VGChartz, SteamDB, corporate earnings reports (Sony, Microsoft, Nintendo, Apple, Alphabet), and developer surveys.
| Platform / Ecosystem | Annual Game Revenue (Gross) | Active Player Base | Annual Game Installs / Sales | Dominant Monetization Model | Typical Platform Cut | Discoverability Reality |
|---|---|---|---|---|---|---|
| Apple App Store | $50B - $52B | ~650M active gamers | ~18 Billion installs | Free-to-Play In-App Purchases (85%), Ads (10%), Subscriptions (5%) | 30% (15% small business under $1M) | Zero organic reach; Top Grossing and paid Apple Search Ads dominate |
| Google Play Store | $30B - $32B | ~2.1B active gamers | ~58 Billion installs | Free-to-Play In-App Purchases (75%), In-Game Ads (22%), Paid (3%) | 30% (15% small business under $1M) | Algorithmic feed; high install churn; paid User Acquisition required |
| Steam (Valve / PC) | $9.5B - $10.5B | 135M+ MAU (38M peak CCU) | ~600M - 700M units sold | Premium Upfront ($10 - $70), In-Game Microtransactions (CS2, Dota) | 30% (drops to 25% at $10M, 20% at $50M) | Tag algorithms, Discovery Queue, user reviews, Seasonal Sales |
| PlayStation Network (Sony) | $26B - $28B | 120M - 123M MAU | ~300M - 350M game & DLC units | Premium Upfront ($40 - $70), Season Passes, PS Plus Subscriptions | 30% standard digital cut | Featured store tiles, brand sales events, PS Plus inclusion |
| Nintendo Switch / eShop | $12B - $14B | 125M+ annual playing users | ~200M+ software units | Premium Upfront ($20 - $60), First-Party Cartridges, NSO Online | 30% standard digital cut | First-party titles capture prime shelf space; eShop search is minimal |
| Xbox Ecosystem (Microsoft) | $13B - $15B | 120M+ MAU (Console + PC) | ~180M+ game & content units | Hybrid Premium Upfront + Game Pass Subscriptions (~34M subs) | 30% standard digital (12% on PC Windows Store) | Game Pass catalog curation, dashboard promo slots |
| Epic Games Store (PC) | $950M - $1.1B | ~75M MAU (270M accounts) | ~100M+ third-party units / claims | Free Game Giveaways, Exclusives, In-Game Purchases (Fortnite) | 12% flat platform fee (0% Unreal Engine royalty) | Free game carousel; user library adoption remains secondary to Steam |
| UGC Platforms (Roblox / UEFN) | $3.5B - $4.0B | 85M+ DAU / 350M+ MAU | Virtual join sessions (billions) | Virtual currency (Robux / V-Bucks), Avatar items, VIP passes | ~70% infrastructure & store cut (~28-30% DevEx creator payout) | Algorithmic feed based on concurrent players, retention, and play time |
Mobile: The Scale Monster and the Monetization Squeeze
Mobile is by far the largest single sector of the global games market, accounting for nearly half of all consumer spend. But operating on mobile requires navigating an extreme disconnect between install volume and revenue capture.
┌────────────────────────────────────────────────────────────────────────┐
│                   THE MOBILE FREE-TO-PLAY CONVERSION SIEVE             │
├────────────────────────────────────────────────────────────────────────┤
│                                                                        │
│   1,000,000 Installs (Acquired via App Stores or Ads)                  │
│       │                                                                │
│       ├─ Day 1 Retention (35% average)  ────────►  350,000 Active      │
│       ├─ Day 7 Retention (12% average)  ────────►  120,000 Active      │
│       ├─ Day 30 Retention (4% average)  ────────►   40,000 Active      │
│       │                                                                │
│       ▼                                                                │
│   Payer Conversion Event (~2.5% of Active Cohort)                      │
│       │                                                                │
│       ├─ 800 Minnows ($1 - $5 lifetime spend)   ──►   $2,400           │
│       ├─ 180 Dolphins ($20 - $100 spend)        ──►   $7,200           │
│       └─ 20 Whales ($500+ spend)                ──►  $20,000           │
│                                                                        │
│   Gross Revenue: $29,600   |   Average Revenue Per Install (ARPI): $0.03│
│   Less 30% App Store Cut: $20,720 net before server and UA costs       │
│                                                                        │
└────────────────────────────────────────────────────────────────────────┘
The Apple vs. Google Volume Paradox
The split between the Apple App Store and Google Play is one of the most famous asymmetries in technology:
- Google Play controls download volume: Android devices represent more than 70% of global smartphone hardware in active use. Google Play drives roughly 58 billion game downloads a year (over three times Apple's volume).
- Apple captures the financial harvest: Despite representing only a fraction of global devices, the iOS App Store consistently generates roughly $52 billion in consumer game spend, compared to Google Play's $31 billion. On average, an iOS gamer generates roughly 3.5 times the revenue of an Android gamer.
The Death of Free Organic Discovery
Prior to 2021, an indie game could get featured on the front page of the iOS App Store or Google Play and ride a wave of several hundred thousand free organic downloads. Today, that playbook is largely extinct.
Following Apple's App Tracking Transparency (ATT) rollout and Google's evolving Privacy Sandbox guidelines, targeted advertising became far more expensive. Mobile gaming has consolidated into a capital-intensive performance marketing game. Casual and hyper-casual games operate on razor-thin margins where studios spend $1.50 on advertising to make $1.65 back in ad views and microtransactions. For midcore and 4X strategy titles, Customer Acquisition Cost (CAC) frequently exceeds $15 to $40 per install, locking out developers who lack multi-million dollar marketing war chests.
PC Gaming: The Open Sea and the Power of Steam
While mobile is dominated by performance marketing and free-to-play funnels, the PC platform operates on fundamentally different psychological principles.
┌────────────────────────────────────────────────────────────────────────┐
│                     PC GAMING MARKET COMPOSITION                       │
├────────────────────────────────────────────────────────────────────────┤
│                                                                        │
│   TOTAL PC GAMING MARKET: ~$40 BILLION ANNUAL REVENUE                  │
│                                                                        │
│   ┌──────────────────────────────────┬───────────────────────────────┐ │
│   │   STEAM (VALVE CORPORATION)      │   DIRECT & PUBLISHER APPS     │ │
│   │   Revenue: ~$10 Billion          │   Revenue: ~$29 Billion       │ │
│   │   MAU: 135 Million               │   Riot Games (Valorant, LoL)  │ │
│   │   Peak CCU: 38+ Million          │   Battle.net (WoW, Diablo)    │ │
│   │   Catalogs: 100,000+ titles      │   HoYoverse (Genshin, Star Rail)│
│   │   Platform Cut: 30% / 25% / 20%  │   Direct Web Payments (0% cut)│ │
│   ├──────────────────────────────────┴───────────────────────────────┤ │
│   │   EPIC GAMES STORE: ~$1 Billion ($310M Third-Party) | 12% Cut   │ │
│   │   GOG, ITCH.IO, MICROSOFT STORE: ~$500 Million combined           │ │
│   └──────────────────────────────────────────────────────────────────┘ │
│                                                                        │
└────────────────────────────────────────────────────────────────────────┘
Why Steam Remains Unshakable
Valve's Steam platform is not just a digital cash register. It is an operating layer for PC gamers.
Despite Epic Games spending hundreds of millions of dollars on exclusivity advances and weekly free game giveaways, Steam's position has actually strengthened:
- The Community Moat: User reviews, Steam Workshop mods, community discussion hubs, cloud saves, and family sharing create massive platform stickiness.
- Hardware Integration: The success of the Steam Deck and SteamOS proved that Valve can extend PC gaming beyond the desktop monitor without requiring a closed console ecosystem.
- The Meritocratic Discovery Engine: Steam's algorithm is driven by user engagement, review sentiment, and wishlist conversions rather than paid banner placements. If a game resonates with players, Steam's algorithm amplifies it across discovery queues and recommendations automatically.
The Wishlist Benchmark
On Steam, the currency of pre-launch momentum is the Wishlist. Unlike mobile pre-registrations (which often convert at under 10%), Steam wishlists represent qualified intent from players with an active payment method on file:
- On average, a Steam game converts 20% to 40% of its pre-launch wishlists into sales during its first week.
- For an indie title aiming for sustainable commercial traction, reaching 10,000 to 15,000 wishlists before launch is widely considered the threshold required to trigger Steam's "Popular Upcoming" and "New & Trending" algorithmic carousels.
Console: The Premium Living Room Citadel
Console gaming represents roughly $53 billion in annual consumer spend. It remains the spiritual home of the prestige blockbuster, high-fidelity graphics, and couch multiplayer.
┌────────────────────────────────────────────────────────────────────────┐
│                     CONSOLE PLATFORM COMPARISON                        │
├────────────────────────────────────────────────────────────────────────┤
│                                                                        │
│   PLAYSTATION (SONY)             NINTENDO SWITCH        XBOX (MICROSOFT)│
│   Revenue: ~$27 Billion          Revenue: ~$13 Billion  Revenue: ~$13B  │
│   MAU: 123 Million               Annual Players: 125M+  MAU: 120 Million│
│   Hardware Base: ~65M (PS5)      Hardware Base: 145M+   Hardware: ~30M  │
│   Average Game: $70 Premium      Average Game: $60 Box  Average: Sub/Buy│
│   Key Driver: Cinematic AAA      Key: 1st Party Magic   Key: Game Pass  │
│                                                                        │
│   Console Characteristics:                                             │
│   - Strict certification requirements (TRC / TCR testing)             │
│   - Mandatory ESRB / PEGI age classifications                          │
│   - Standard 30% platform distribution take rate                      │
│   - Extremely high player willingness to pay for premium titles       │
│                                                                        │
└────────────────────────────────────────────────────────────────────────┘
The Three Console Philosophies
The console market is divided among three platform holders with starkly divergent business models:
Sony PlayStation (The AAA Prestige Powerhouse): Sony dominates the traditional high-end console space. PlayStation Network generates more digital revenue than Steam and Nintendo combined, driven by a blend of $70 cinematic exclusives (God of War, Spider-Man) and massive in-game spending on third-party blockbusters like Call of Duty, EA Sports FC, and Fortnite.
Nintendo (The Evergreen First-Party Fortress): Nintendo operates in a category of its own. While PlayStation and Xbox rely heavily on third-party royalties, Nintendo generates the overwhelming majority of its software profits from its own internal IP. A flagship Nintendo game like Mario Kart 8 Deluxe or The Legend of Zelda: Tears of the Kingdom routinely sells 20 million to 60 million copies over its lifetime at near-full price, with virtually zero price degradation over half a decade.
Microsoft Xbox (The Ecosystem and Subscription Play): Following its acquisitions of ZeniMax/Bethesda and Activision Blizzard King, Microsoft shifted focus away from standalone hardware unit sales toward an ecosystem model. With Xbox Game Pass commanding over 34 million subscribers across console and PC, Microsoft is training gamers to treat titles as an all-inclusive catalog subscription rather than a collection of individual retail purchases.
The UGC and Proto-Metaverse Frontier: Roblox and Fortnite UEFN
No modern analysis of game platform markets is complete without examining the explosive rise of User-Generated Content (UGC) gaming environments.
For millions of players under the age of eighteen, their primary gaming platform is neither Steam nor a console dashboard. It is a single app that acts as an entire games ecosystem.
┌────────────────────────────────────────────────────────────────────────┐
│                   TRADITIONAL APPS VS. UGC PLATFORMS                   │
├────────────────────────────────────────────────────────────────────────┤
│                                                                        │
│   TRADITIONAL STORES (STEAM, PSN, APP STORE)                           │
│   - Developer ships compiled binary executable                         │
│   - Platform takes 12% to 30% cut                                      │
│   - Developer pays for dedicated game servers, backend, and CDN        │
│   - Player must download separate 5GB - 80GB package per game          │
│   - Developer Net Margin: 70% to 88%                                   │
│                                                                        │
│   UGC ECOSYSTEMS (ROBLOX, FORTNITE UEFN)                               │
│   - Developer builds within platform sandbox runtime                   │
│   - Platform takes ~60% to 72% cut (Infrastructure, Store, Hosting)    │
│   - Platform handles global multiplayer networking, physics, avatars   │
│   - Player joins instantly in 2 seconds from friend list               │
│   - Developer Net Margin: 28% to 40% (DevEx / Engagement Pools)        │
│                                                                        │
└────────────────────────────────────────────────────────────────────────┘
The Tradeoff of the Sandbox
Building for platforms like Roblox or Fortnite Creative / Unreal Editor for Fortnite (UEFN) offers an unbeatable discovery advantage: instant friction-free onboarding. A player can tap a thumbnail on their phone or console and be running around in your multiplayer game world within three seconds.
The cost, however, is margin:
- On Roblox, after accounting for Apple/Google 30% mobile app store fees, platform infrastructure hosting, moderation, and currency conversion, developers receive a Developer Exchange (DevEx) payout rate of roughly 28% to 30% of gross player spending.
- Despite that steep platform fee, top Roblox development studios (such as the creators of Adopt Me!, Blox Fruits, and Brookhaven) generate tens of millions of dollars in annual profit, out-earning traditional mid-tier AA game studios with a fraction of the engineering overhead.
Unit Economics: Take Rates, Fees, and Developer Realities
Where a game lives determines how much money reaches the studio bank account after platform commissions, payment processing, tax withholding, and user acquisition expenses.
┌────────────────────────────────────────────────────────────────────────┐
│               NET DEVELOPER MARGIN ON $100 GROSS SPEND                 │
├────────────────────────────────────────────────────────────────────────┤
│                                                                        │
│   EPIC GAMES STORE (12% Store Cut)                                     │
│   [██████████████████████████████████████░░░░░░] $78.00 Net Take       │
│                                                                        │
│   STEAM / CONSOLE (30% Standard Digital Cut)                           │
│   [████████████████████████████░░░░░░░░░░░░░░░░] $60.00 Net Take       │
│                                                                        │
│   ROBLOX DEVEX (~29% Creator Revenue Share)                            │
│   [██████████████░░░░░░░░░░░░░░░░░░░░░░░░░░░░░░] $29.00 Net Payout     │
│                                                                        │
│   MOBILE F2P (After 30% Store Cut + 55% User Acquisition Reinvestment) │
│   [███░░░░░░░░░░░░░░░░░░░░░░░░░░░░░░░░░░░░░░░░░] $7.00 - $12.00 Margin│
│                                                                        │
└────────────────────────────────────────────────────────────────────────┘
The takeaway from these unit economics is striking: a dollar of gross mobile revenue is fundamentally different from a dollar of gross PC or console revenue.
Because mobile requires relentless re-investment of cash flow into paid advertising networks to maintain Top Grossing chart ranking, a mobile studio generating $10 million in top-line revenue often retains less net operating income than an indie PC studio generating $2 million in lifetime Steam sales.
Strategic Playbook: Matching Your Game to the Right Platform
Before writing a single line of code or choosing an engine, every development team should evaluate where their design naturally belongs:
When PC (Steam) is the Right Primary Target:
- Systems-heavy games (deckbuilders, management simulations, survival, roguelikes, 4X strategy).
- Deep keyboard-and-mouse or gamepad controls requiring fine precision.
- Games with high replayability that thrive on Twitch, YouTube, and player community mods.
- Teams without a multi-million dollar performance marketing budget that rely on organic algorithmic discovery.
When Console (PlayStation / Switch / Xbox) is the Right Target:
- Highly polished narrative adventures, action-platformers, and cinematic games.
- Games that look stunning on an HDR living room television at 60 FPS.
- Family-friendly multiplayer games that excel on Nintendo hardware.
- Projects that can secure platform funding, co-marketing deals, or subscription catalog guarantees (Game Pass, PS Plus).
When Mobile (iOS / Android) is the Right Target:
- Short-session, one-finger touch experiences designed for fragmented daily routines.
- Social casual games with inherent viral sharing loops or asynchronous multiplayer.
- Studios with seasoned in-house performance marketing, live operations, and ad mediation expertise.
- Established IP that already possesses massive global name recognition.
When UGC (Roblox / UEFN) is the Right Target:
- Fast, chaotic social multiplayer games aimed at Gen Z and Gen Alpha players.
- Rapid prototyping teams that want to iterate on game mechanics weekly based on live telemetry.
- Studios that want to offload networking infrastructure, server hosting, and cross-platform porting to a host runtime.
The Road Ahead: Cross-Platform Convergence
The historical walls separating these platform ecosystems are crumbling.
Today, the most resilient game franchises - from Minecraft and Fortnite to Genshin Impact, Call of Duty: Warzone, and Roblox - operate seamlessly across all of them. Modern development tools like Unreal Engine, Unity, Godot, and modular C#/.NET backends allow studios to target desktop, console, mobile, and web from a single codebase.
The winning strategy for modern game makers is rarely to build exclusively for one walled garden forever. The best studios build their core game loops on the platforms with the lowest discovery barriers (often PC or UGC), prove their player retention, and then expand outward into mobile scale and console prestige as their audience grows.